เริ่มต้นใช้งาน
System status: is Nerve working?
Read the status badge and panel: what each state means, why "not wired" is not a fault, and where to check past incidents.
อัปเดตล่าสุด
Who this is for: everyone with an account — no permission is required to open the status panel. Where: the coloured dot at the end of the app header, on every screen
The coloured dot in the app header is the system status badge. It tells you at a glance whether the services Nerve depends on are working, and opening it gives you the detail: which service, how fast it answered, and when it was last checked.
It answers a narrower question than "is something wrong", and the narrowness is what makes it useful. It reports on Nerve's own services — the API, the database behind it, sign-in, and the channels Nerve sends email through. It knows nothing about your property's network, your Wi-Fi, or a channel partner's systems. When the badge is blue and a screen is still misbehaving, the problem is somewhere Nerve cannot see, which is itself worth knowing in the first thirty seconds.
Read the badge#
The dot takes the colour of the worst service currently reporting.
| Badge | Meaning |
|---|---|
| Blue | Everything Nerve depends on is answering normally. |
| Amber, pulsing | Something works but not properly — usually slower than it should be. Nerve will feel sluggish rather than broken. |
| Red, pulsing | Something Nerve depends on is not answering. Expect screens to fail rather than just lag. |
A pulsing dot is asking for attention. A steady blue one is not.
Open the panel#
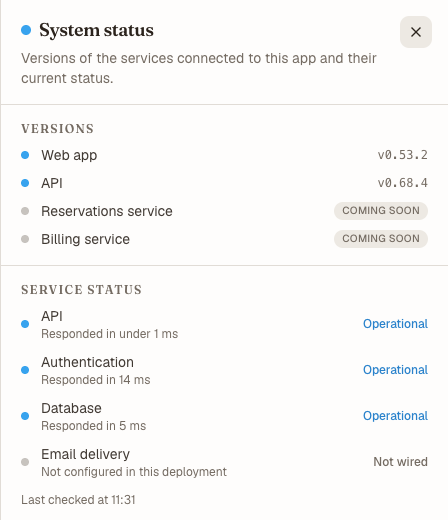
Select the dot. A panel opens from the side, in two sections.
Versions#
Which build of each part of Nerve you are running. Web app is the screen you are looking at; API is the service behind it.
They carry separate version numbers on purpose. Nerve is released as separate parts on their own schedules, and a deploy routinely moves one and not the other — so "it broke after an update" is not answerable without both numbers. If you are reporting a problem, these two are the single most useful thing to include.
The web app's version is also printed quietly under the sign-in form, so you can read it without an account.
Rows marked Coming soon are services that do not exist yet. They are listed so the panel's shape does not change under you when they arrive, and they sit greyed out — the same grey as anything else Nerve has not connected. A blue dot beside them would say a service had been checked and found healthy, and there is nothing there to check.
Service status#
One row per service Nerve actually checked, with the result of that check. Each row is measured live while the panel is open — roughly once a minute — rather than being a status somebody typed in.
| State | What it means |
|---|---|
| Operational | The check succeeded and came back quickly. |
| Degraded | The service answered, but slower than it should. Nothing has failed; something is straining. |
| Outage | The check got no answer. Anything depending on this service will fail. |
| Not wired | There is no such service configured on your Nerve. Nothing is broken — there is nothing there to check. |
The note under each row carries the detail: how long the check took, or why it could not complete. A healthy service usually reads Responded in under 1 ms — these checks normally answer far faster than a person can perceive, which is why even a few hundred milliseconds is reported as degraded.
At the foot, Last checked at tells you how fresh the reading is, in your property's local time. If it is more than a couple of minutes old, close the panel and open it again.
"Not wired" is not a fault#
This is the one row most often misread, so it is worth stating plainly.
Not wired means your Nerve installation has no service connected for that function at all. The common case is email: where no mail provider has been connected, Nerve records the messages it would have sent instead of delivering them. Nothing is failing. Nothing is arriving either.
So if you expect guests to be receiving booking confirmations and the email row reads Not wired, that is the finding — and it is a setup task for whoever administers your Nerve, not an incident to report as an outage.
A not wired service never colours the badge, for the same reason: a service your property never configured is not having an incident, and if it turned the dot amber you would quickly learn to ignore the dot.
When Nerve itself cannot be reached#
If the API is unreachable, the panel cannot show a service list — the list comes from the API. It tells you exactly that instead: the API row turns red, its version reads Unknown, and the service section says the status is unavailable.
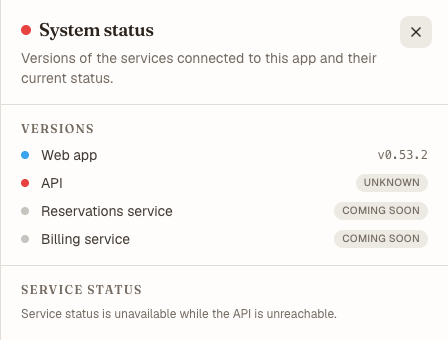
That is deliberate. Leaving the last-known list on screen would look current and be wrong, which is worse than showing nothing.
This is also the only case the panel works out for itself. Everything else it shows was reported by the API; an API that cannot be reached cannot report anything, so your browser's failed request is the measurement.
Check past incidents#
The panel shows the situation right now. It has no memory — it cannot tell you whether Nerve was down at three in the morning, or how long a slow patch lasted.
That history lives on Nerve's public status page, which is checked from outside our network. The distinction matters: a check running inside Nerve can only report while Nerve is running, so the record of an outage has to be kept by something that stayed up during it. The status page holds the uptime record and the incident timeline, and you can subscribe to be notified when an incident opens or resolves.
หมายเหตุ
The public status page is being set up. Until it is live, report anything reading Degraded or Outage to support, with the two version numbers and what the row said.
In other languages#
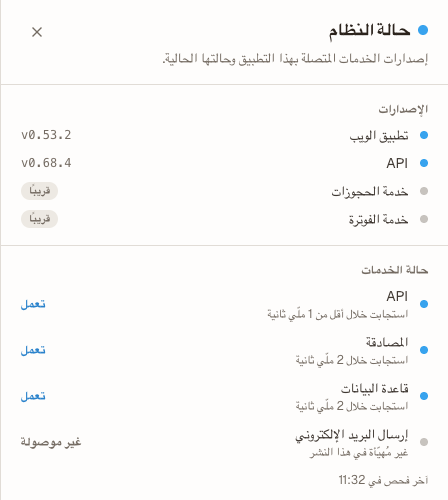
The panel follows the language set on your account, including right-to-left layouts. Times follow your property's timezone rather than your own, as everywhere else in Nerve — so a colleague reading in another language sees the same instant you do, written in their own words.
What to include when you report a problem#
This panel gives you almost everything useful at once:
- The Web app and API version numbers.
- Which service row is not Operational, and the note under it.
- The Last checked at time.
- What you were doing, and what you saw instead.
เคล็ดลับ
Before reporting, check whether the error is scoped to one screen. A screen you cannot use is far more often a permission you do not hold than a service that is down — see why your menu differs from a colleague's — and the status panel will be blue in that case, which is the panel telling you where not to look.
What's next#
- Sign in and find your way around — the header the badge sits in
- Why your menu differs from a colleague's — the more likely cause of a screen you cannot reach